Showing posts with label open paper. Show all posts

Tuesday, July 22, 2014

paper trade2! - blfs

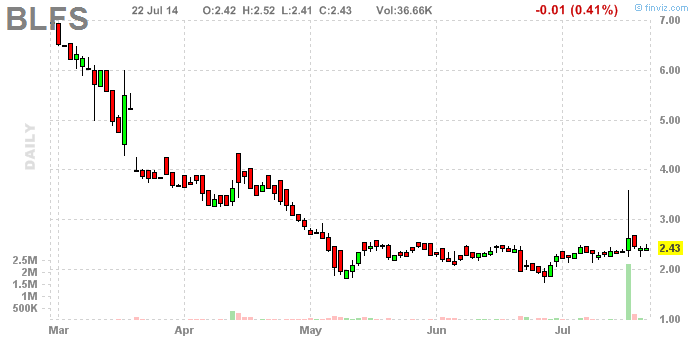
I looked at a few more stocks - another ten or twenty - and found another signal.


The buy price is 2.42. That sounds like extreme precision, but it's slightly arbitrary. It's based, at any rate, on prices just before the breakout, which, by the way, was, of course, four days ago. It's a good breakout, not that that's a guarantee of anything. A decent breakout, at any rate. Again, this is a way to test an idea. If you want to trade these "tips", that's your business. (Can you understand anything I'm saying? I wonder if you'll understand me better after reading dozens of my posts.) The stop is 2.15, which is a 10% loss. That's a decent size loss. Maybe I need to think this over. Very close inspection of the pattern suggests a buy price of 2.35, and a stop at 2.27. That appears to be a 3% loss, making the trade more attractive.

This, however, might be an example of why "trading" versus "investing" might be kind of a bad idea. Basically, "investing" is a longer term proposition, with bigger goals. And the monthly chart for BLFS suggests an "investment".
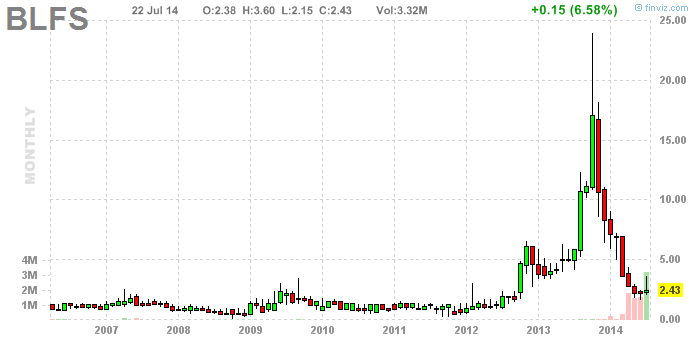


BLFS is going to 24, and probably beyond. But, you will need to wait. It probably won't even start to move for a year. Still, it could. Warren Buffet actually plans on holding for years, and he doesn't care how long it takes for a stock to get going, or so he says. He says he can't predict that. On the other hand, he studies the fundamentals. We could do that, to confirm what this chart is saying, which is basically that it's a good company, at a good price. See you in two years.

updating charts:

paper trade 1! - anad

Here's what I did this afternoon: I looked at several charts on my amazing home made charting system, and on about chart number 10 there was a breakout. That's our buy signal. It's a teeny tiny buy signal, but the point isn't to choose between buy signals, it's to test the idea that they are worth paying attention to. In a few weeks, or even days, we'll know if this one was. This, folks, is paper trading.


OK. The buy signal is the big green bar at the end of the chart. The buy price is - this is sort of guess work, but - the top of the second to last bar. The stop, and you need to use a stop, is, um, just below the June low.

The next question is, where is this going? In the short term, it's basically $1.20. Just look at the pattern on the daily chart. $1.20 isn't a giant profit, but if you put $1000 in, you can make some money. You need a stop to put $1000 in, otherwise, you risk losing your whole investment. That could happen with a stop, but it's unlikely.

The next target is on the weekly chart, at something like $1.80. That's pretty good money, and it should be reached pretty soon, but you'll probably see a pause at $1.20, and a pause means prices going down, probably to your buy price. If you can sell at $1.20, you can probably buy back near today's buy price, then sell again at $1.80.

Eventually this will probably go to $8, and then $20, but that's a long way off.

Here are the updating charts (you can follow the stocks on these charts):