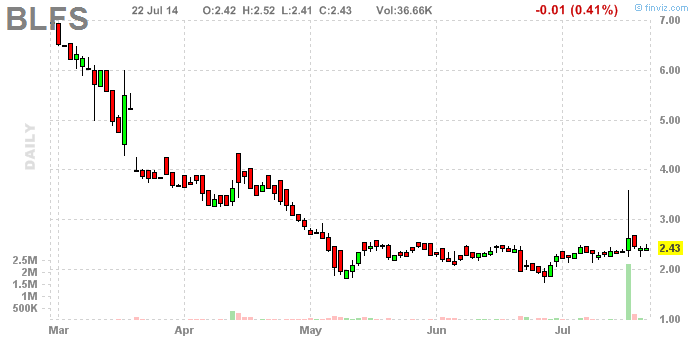
The buy price is 2.42. That sounds like extreme precision, but it's slightly arbitrary. It's based, at any rate, on prices just before the breakout, which, by the way, was, of course, four days ago. It's a good breakout, not that that's a guarantee of anything. A decent breakout, at any rate. Again, this is a way to test an idea. If you want to trade these "tips", that's your business. (Can you understand anything I'm saying? I wonder if you'll understand me better after reading dozens of my posts.) The stop is 2.15, which is a 10% loss. That's a decent size loss. Maybe I need to think this over. Very close inspection of the pattern suggests a buy price of 2.35, and a stop at 2.27. That appears to be a 3% loss, making the trade more attractive.
This, however, might be an example of why "trading" versus "investing" might be kind of a bad idea. Basically, "investing" is a longer term proposition, with bigger goals. And the monthly chart for BLFS suggests an "investment".
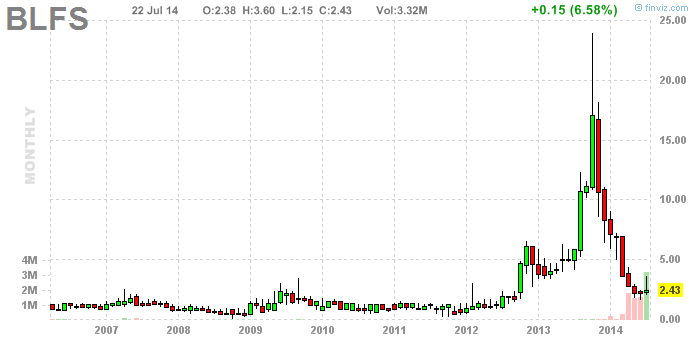
BLFS is going to 24, and probably beyond. But, you will need to wait. It probably won't even start to move for a year. Still, it could. Warren Buffet actually plans on holding for years, and he doesn't care how long it takes for a stock to get going, or so he says. He says he can't predict that. On the other hand, he studies the fundamentals. We could do that, to confirm what this chart is saying, which is basically that it's a good company, at a good price. See you in two years.
updating charts:
No comments:
Post a Comment