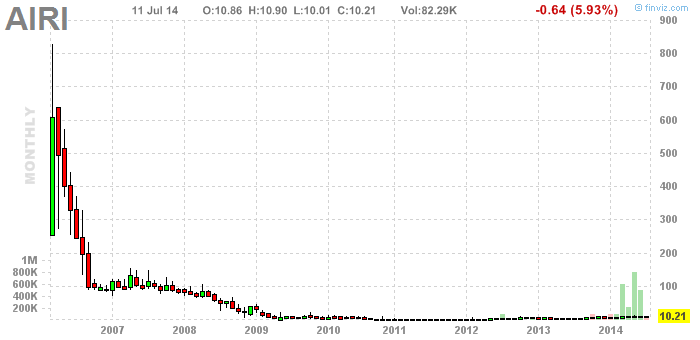
You are now looking at a great, great chart. It's kind of funny because you can barely see what's so great about it, but, actually, even in this chart, you can see it.
Certain students of mine (lol) will recognize this as the kind of chart I always get excited about, but a lot of those flings have turned out to be duds. It's funny because I didn't get interested in this stock because of this chart. There's something in this chart that distinguishes it, and in a dramatic way.
The charts on this page are "static". They will always show this pattern, the pattern I'm saying has so much potential. I'll put dynamic charts in the next post. Those will always show the latest prices, and they'll show what happened since ... now.

I guess the weekly chart is what attracted me. It's up. Normally (as my students will testify) I am wary of stocks that are up, but I think, because of that, I'm missing out. This stock is up with benefits. Love it.
If I had $10,000 in cash, I would put $1000 into this stock. I would call that a safe bet. I can predict, but I can't guarantee my predictions.
AIRI is pressing against earlier highs, persistently, with surging volume. It is breaking out. It's also down a little, short term, at support. It's well priced at this moment. I could turn out to be completely wrong about it, but I think, in this instance, it's a chance well worth taking.
I think it's important to know where this is going. The long term chart suggests it's going almost to a thousand dollars. I bet it is! But I do not think it is going there in one fell swoop. Look very closely at January, 2009. The top was at about 50. That's where it will pause again, for several months. When it's ready to move again, it'll let us know. Hey, I don't like buying and selling like this. It's unseemly. We should buy great companies and hold them for the long term. I might be completely wrong to suggest trying to sell tops like this ... but, I can't help it. Holding a stock in which we had a nice profit, while it goes down, and up part way, and down again, and up part way again, is too painful. From my faulty heart (help me, Warren Buffett) I can only recommend selling at $50 (buying at $10). Then you start looking for the next opportunity.
I've said it before, a great chart tends to be a good company. AIRI has grown revenues, at a measure pace, for five years, and it has grown earnings, and is distinctly profitable. It's even fairly big. P/E is moderate ... and let's check ... Price-book is on the high side. There's a flaw in this gem. It is a gem, so we need to decide whether that one flaw is consequential. It does suggest one possibility, which the chart also suggests: a 2/3 decline, a decline to 3. That's the risk in this chart. It sure looks like it wants to break out. And it's a strong company ... if it goes to 3, it will eventually recover.
The chart itself, this pressing upward action, is so compelling, I think it would be foolish not to buy this. The last word is, diversify. If you ever find an actually perfect stock, let me know.
No comments:
Post a Comment